 I had a chance encounter the other day with a media mogul. Successful, wealthy, intelligent. Well, maybe the latter part of that statement may need examination, as he expressed a desire to get involved in racing and breeding. Of all things. Anyway, we got talking and he clearly knew a thing or two. Stallions, he said, have to be the key to success. And could I help him with solid background information in that respect. Give me something out of the ordinary, he added.
Interesting request. But where to start?
My area of expertise is rating horses on ability. I’ve done it for a good few decades, and I know the method works for racehorses. So if it works for them, why not for stallions? Take a large enough sample from a database, and see what happens when you take all progeny and rate them as a group. Would that reveal anything useful?
First a little background
In short, a rating is an assessment of the best ability of a horse, as shown on the track. Ability is inborn – you have what you’re given by your parents, no more, no less. Maturity, good training, sensible feeding – those are factors that bring out a horse’s inherent ability, but they won’t be able to improve on it. You either have it, or you don’t.
Most horses’ ability is average, for that’s how nature works: regression to the mean. Some horses may be better, some will be worse. But on average, the ability in a horse population remains quite constant from year to year. And a rating shows how much better or worse a horse is compared to the mean rating of the population as a whole.
For convenience, ratings are expressed in weight – pounds in the UK, and comparable half-kilo’s in most of the rest of the world.
Ratings can be applied in a wide variety of ways, foremost to frame handicap weights on a day-to-day basis. Creatively applied, ratings can inform about many different things and give them bite. Including, hopefully, stallion statistics.
The first thing to do is to establish benchmarks. Individual ratings would give too much variety in graphs, so the thing to do is make ratings ‘bins’, groups of ratings, in a statistically sensible way.
For this all stallions with runners in the 2013/14 season were selected, and for all of them all their runners from the last ten years, with their career-best ratings. The bins look like this, with the bar-graph showing the percentage of runners for all stallions in each bin.
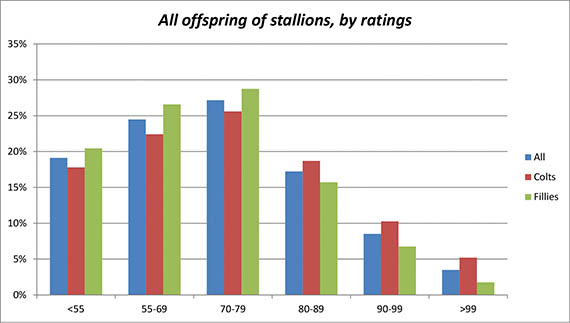
All Offspring of Stallions, by ratings
All offspring of stallions by ratings – as a table
| Rating bins | <55 | 55-69 | 70-79 | 80-89 | 90-99 | >99 |
| All | 19% | 24% | 27% | 17% | 9% | 3% |
| Colts | 18% | 22% | 26% | 19% | 10% | 5% |
| Fillies | 20% | 27% | 29% | 16% | 7% | 2% |
To give the rating bins perspective, all black type winners from the ten-year period were selected, with the ratings recorded with the wins (in other words, not the career-best ratings of the winning horses). The bar-graphs again reflect percentages in each bin.
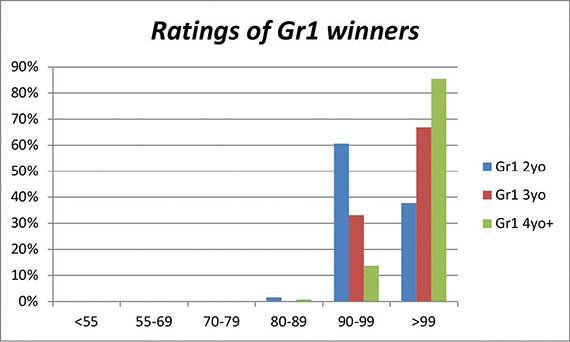
Ratings of Gr1 winners
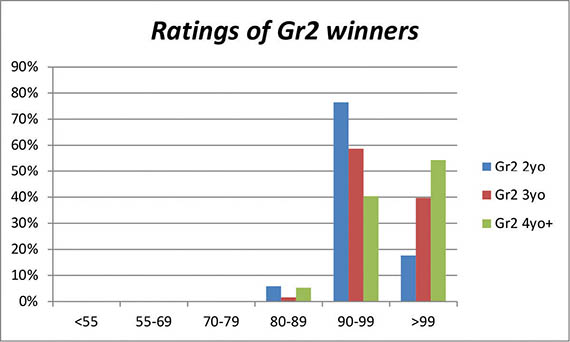
Ratings of Gr2 winners
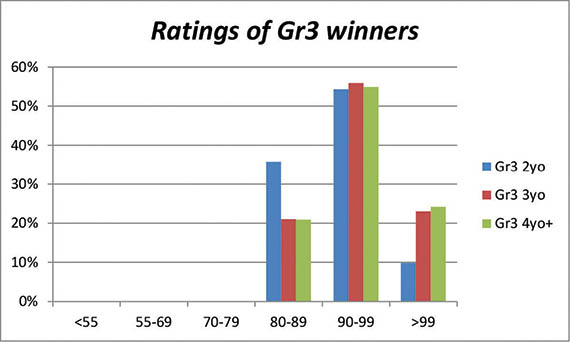
Ratings of Gr3 winners
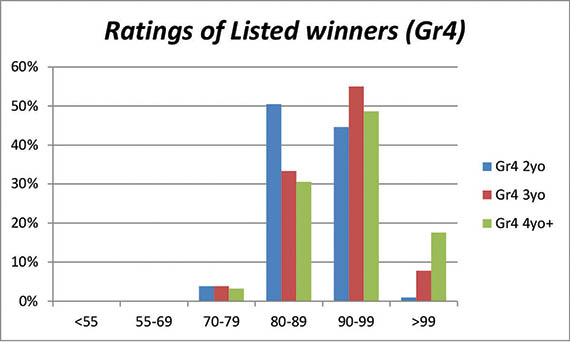
Ratings of Listed winners
The bar-graphs give a clear idea of what kind of rating is needed to win at the four levels of Graded and Listed races.
It appears that the 90-99 bin is a minimum requirement for bold caps black-type.
It also appears that the conventional wisdom that ‘Gr1 horses win Gr1 races’ in the main rings true (excluding 2yo’s).
.
Now for the real stuff
A selection of notable stallions is assembled below, to compare. The bar-graphs show the percentages of rated offspring in each bin for nine sires.
There are ten bars in all in each bin. On the left the population average (shown earlier on its own, in the first bar-graph), then next to it in alphabetical order nine stallions (their names and bar-colour next to the graph).
The stallions in the example are regulars in the top-sire stats. You’d expect their bars to be below the population-average (the blue bar on the left in each bin) in the lefthand side bins, and above it on the righthand side. Not unexpectedly, there are major differences between the nine stallions.
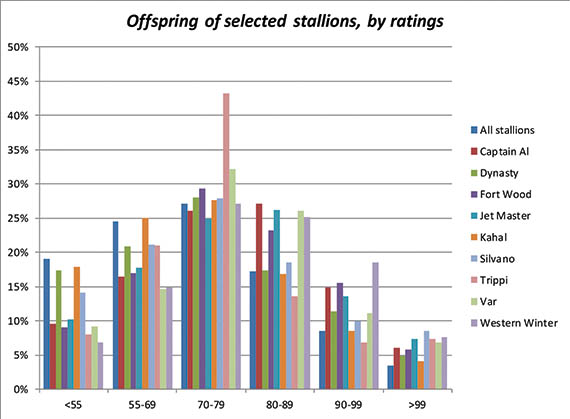
Offspring of Selected Stallions, by Ratings
The bar-graphs give a good visual idea, but to combine bins it is easier to work with a table.
Offspring of selected stallions, by percentage in rating-groups – as a table
| Rating bins | <55 | 55-69 | 70-79 | 80-89 | 90-99 | >99 |
| All stallions | 19% | 24% | 27% | 17% | 9% | 3% |
| Captain Al | 10% | 16% | 26% | 27% | 15% | 6% |
| Dynasty | 17% | 21% | 28% | 17% | 11% | 5% |
| Fort Wood | 9% | 17% | 29% | 23% | 16% | 6% |
| Jet Master | 10% | 18% | 25% | 26% | 14% | 7% |
| Kahal | 18% | 25% | 28% | 17% | 9% | 4% |
| Silvano | 14% | 21% | 28% | 19% | 10% | 8% |
| Trippi | 8% | 21% | 43% | 14% | 7% | 7% |
| Var | 9% | 15% | 32% | 26% | 11% | 7% |
| Western Winter | 7% | 15% | 27% | 25% | 18% | 8% |
Let’s do some maths and make observations.
Kahal is virtually the same as the population-average in all bins.
Silvano and Western Winter jointly lead in the top-bin, with double the population average. The pack is close on their heels, though.
When the two top-bins are combined, Western Winter is in a class of his own with 27%, followed by Fort Wood, Captain Al and Jet Master.
Combine the top three bins and you’ll find Western Winter on 52%, Captain Al 48%, Jet Master on 47%, Fort Wood 45% and Var 45%. The overall population-average for the three bins is 30%.
Then the reverse side of the coin, the low bins. The under-55 bin horse is unlikely to ever win a race, while the 55-69 bin is filled with mostly modest winners – if at all.
It’s again Western Winter who comes off best, with the lowest percentage in the lowest-rating bin. When the two lowest-rating bins are combined, the population average is 44%, this vs. 21% for Western Winter, who leads here, too.
When statistical methods are applied to a ratings population, there is a significant difference between the sexes in terms of mean. The difference equates to about 3 points – which is reflected in races as sex-allowance.
Rating-bins show dramatic changes when split by sex, also reflected in the population averages against which the sires must be measured.
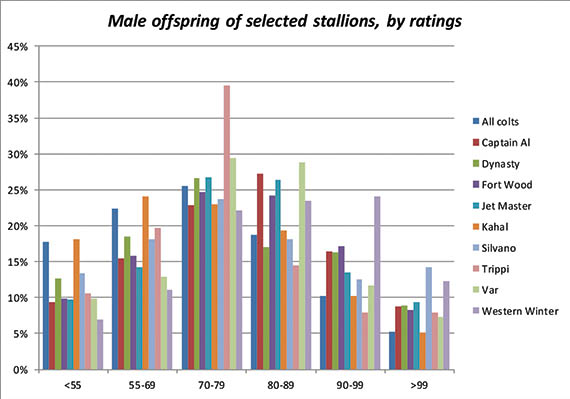
Male Offspring of Selected Stallions, by Ratings
Male offspring of selected stallions, by ratings – as a table
| Rating bins | <55 | 55-69 | 70-79 | 80-89 | 90-99 | >99 |
| All colts | 18% | 22% | 26% | 19% | 10% | 5% |
| Captain Al | 9% | 15% | 23% | 27% | 16% | 9% |
| Dynasty | 13% | 19% | 27% | 17% | 16% | 9% |
| Fort Wood | 10% | 16% | 25% | 24% | 17% | 8% |
| Jet Master | 10% | 14% | 27% | 26% | 14% | 9% |
| Kahal | 18% | 24% | 23% | 19% | 10% | 5% |
| Silvano | 13% | 18% | 24% | 18% | 13% | 14% |
| Trippi | 11% | 20% | 39% | 14% | 8% | 8% |
| Var | 10% | 13% | 29% | 29% | 12% | 7% |
| Western Winter | 7% | 11% | 22% | 23% | 24% | 12% |
.
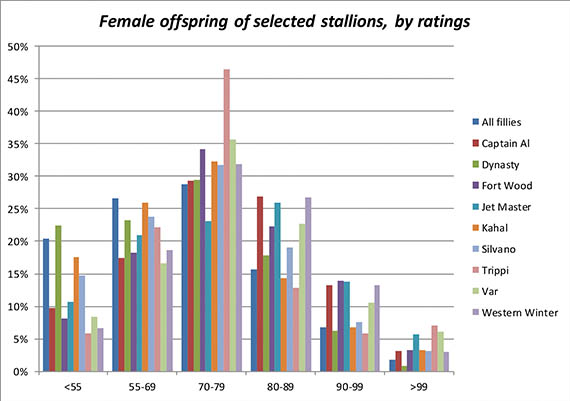
Female Offspring of Selected Stallions, by Ratings
Female offspring of selected stallions, by ratings – as a table
| Rating bins | <55 | 55-69 | 70-79 | 80-89 | 90-99 | >99 |
| All fillies | 20% | 27% | 29% | 16% | 7% | 2% |
| Captain Al | 10% | 17% | 29% | 27% | 13% | 3% |
| Dynasty | 22% | 23% | 29% | 18% | 6% | 1% |
| Fort Wood | 8% | 18% | 34% | 22% | 14% | 3% |
| Jet Master | 11% | 21% | 23% | 26% | 14% | 6% |
| Kahal | 18% | 26% | 32% | 14% | 7% | 3% |
| Silvano | 15% | 24% | 32% | 19% | 8% | 3% |
| Trippi | 6% | 22% | 47% | 13% | 6% | 7% |
| Var | 8% | 17% | 36% | 23% | 11% | 6% |
| Western Winter | 7% | 19% | 32% | 27% | 13% | 3% |
Sex Matters
The population percentage in the top-bin was 4% with sexes combined, but when split by sex the colts are 5% and fillies 2%. Combine the top-two bins, and the overall 13% (both sexes together) becomes 15% for colts, and 9% for fillies. Similarly, the top-three bins’ overall percentage of 30% becomes 34% for colts and 25% for fillies.
The conclusion is that in general terms fillies aren’t ‘as good’ racehorses as colts (could it be because most were gelded?).
Leaders in the top-bin for colts are Silvano and Western Winter, both more than twice as high as the overall population percentage for colts.
With fillies it is a different story. There the top-bin honours are disputed by Trippi, Jet Master and Var – all achieving three times the population average for their sex. Things change further when the top-two bins are combined.
For the colts Western Winter is a clear leader, the only sire to more than double the overall average for the sex. Some way behind him follow Captain Al, Dynasty, Silvano and Fort Wood. With three bins Western Winter stays well ahead of Captain Al, and the closely grouped Fort Wood, Jet Master and Var.
In the fillies’ top-two bins Jet Master doubles the female population average, followed by Fort Wood, Var, Captain Al, and Western Winter. With three bins the picture remains the same.
.
Fun With Numbers
So is there a real use with this for our inquisitive media mogul?
Presumably, if he had a shortlist of comparable yearlings to buy, this information can help in making the final decision. Or if he wanted to buy a broodmare, or breed a mare to a shortlist of stallions with the objective of hitting a big one, then for that too the information could help.
The real point is that rating evaluation provides insight which cannot be gleaned from commonly used stats, such as those based on seasonal earnings or black type performance.
If you’d like to see it all, here’s a list of sires who had runners last season, with performance of offspring going back a decade. To add another level, they have been grouped by year of first crop, and then alphabetically within those groups. Your thoughts, discoveries, and comments are appreciated.
– Karel Miedema
Offspring of sires by rating
| Stallions | <55 | 55-69 | 70-79 | 80-89 | 90-99 | >99 |
| All stallions | 19% | 24% | 27% | 17% | 9% | 3% |
| First crop 1994 | ||||||
| Fort Wood | 9% | 17% | 29% | 23% | 16% | 6% |
| First crop 1998 | ||||||
| Western Winter | 7% | 15% | 27% | 25% | 18% | 8% |
| First crop 1999 | ||||||
| Muhtafal | 14% | 21% | 26% | 24% | 11% | 4% |
| First crop 2002 | ||||||
| Captain Al | 10% | 16% | 26% | 27% | 15% | 6% |
| Century Stand | 23% | 35% | 26% | 13% | 1% | 2% |
| Count Dubois | 21% | 20% | 30% | 19% | 8% | 3% |
| Jet Master | 10% | 18% | 25% | 26% | 14% | 7% |
| Kahal | 18% | 25% | 28% | 17% | 9% | 4% |
| Lecture | 17% | 29% | 30% | 14% | 7% | 3% |
| First crop 2003 | ||||||
| Almushtarak | 35% | 22% | 27% | 14% | 2% | 0% |
| Announce | 14% | 32% | 30% | 14% | 9% | 1% |
| Asaal | 33% | 22% | 22% | 13% | 9% | 0% |
| Doowaley | 18% | 27% | 26% | 18% | 7% | 3% |
| Indigo Magic | 23% | 28% | 27% | 18% | 4% | 0% |
| Mogok | 20% | 23% | 30% | 17% | 7% | 2% |
| The Sheik | 28% | 24% | 28% | 13% | 6% | 1% |
| Windrush | 20% | 25% | 28% | 18% | 6% | 2% |
| First crop 2004 | ||||||
| Badger’s Drift | 15% | 26% | 35% | 16% | 5% | 3% |
| Silvano | 14% | 21% | 28% | 19% | 10% | 8% |
| First crop 2005 | ||||||
| Bezrin | 26% | 27% | 26% | 13% | 4% | 4% |
| Malhub | 36% | 27% | 20% | 9% | 7% | 1% |
| Sarge | 20% | 34% | 30% | 11% | 4% | 1% |
| First crop 2006 | ||||||
| Alado | 24% | 41% | 24% | 0% | 10% | 0% |
| Dupont | 28% | 27% | 22% | 18% | 3% | 2% |
| Dynasty | 17% | 21% | 28% | 17% | 11% | 5% |
| Spectrum | 21% | 29% | 29% | 14% | 6% | 1% |
| Toreador | 21% | 32% | 26% | 14% | 7% | 1% |
| Var | 9% | 15% | 32% | 26% | 11% | 7% |
| First crop 2007 | ||||||
| Battersea Park | 38% | 31% | 23% | 0% | 8% | 0% |
| Black Minnaloushe | 25% | 27% | 26% | 14% | 7% | 2% |
| Damage is Done | 60% | 10% | 20% | 0% | 10% | 0% |
| Greys Inn | 23% | 28% | 24% | 16% | 6% | 2% |
| Jam Alley | 43% | 27% | 20% | 3% | 7% | 0% |
| King of Kings | 30% | 30% | 25% | 11% | 3% | 1% |
| Lundy’s Liability | 20% | 40% | 18% | 12% | 7% | 2% |
| Miesque’s Approval | 23% | 31% | 30% | 12% | 5% | 0% |
| Overlord | 21% | 33% | 33% | 9% | 4% | 0% |
| Right Approach | 20% | 29% | 29% | 13% | 7% | 2% |
| Scripture | 75% | 25% | 0% | 0% | 0% | 0% |
| Solskjaer | 26% | 39% | 18% | 12% | 3% | 2% |
| Stagelight | 28% | 44% | 17% | 11% | 0% | 0% |
| Tiger Dance | 24% | 32% | 31% | 7% | 4% | 1% |
| Way West | 35% | 31% | 23% | 5% | 5% | 0% |
| Whitechapel | 42% | 33% | 17% | 6% | 3% | 0% |
| First crop 2008 | ||||||
| Go Deputy | 21% | 31% | 24% | 15% | 6% | 3% |
| Tobe Or Nottobe | 37% | 28% | 28% | 7% | 0% | 0% |
| First crop 2009 | ||||||
| Ashaawes | 29% | 24% | 26% | 11% | 8% | 1% |
| Atso | 36% | 45% | 11% | 7% | 1% | 0% |
| Imperial Stride | 32% | 27% | 22% | 13% | 7% | 0% |
| Lion Tamer | 35% | 29% | 21% | 15% | 0% | 0% |
| Mullins Bay | 20% | 34% | 30% | 13% | 2% | 1% |
| Ravishing | 41% | 33% | 16% | 8% | 2% | 0% |
| Soar With Eagles | 32% | 35% | 18% | 12% | 3% | 0% |
| St Petersburg | 43% | 35% | 14% | 6% | 2% | 0% |
| Trippi | 8% | 21% | 43% | 14% | 7% | 7% |
| First crop 2010 | ||||||
| A P Arrow | 32% | 48% | 16% | 2% | 2% | 0% |
| Admire Main | 26% | 29% | 39% | 3% | 0% | 3% |
| Antonius Pius | 24% | 26% | 27% | 16% | 8% | 0% |
| Argonaut | 35% | 30% | 25% | 6% | 3% | 0% |
| Daring Bid | 59% | 29% | 6% | 6% | 0% | 0% |
| Horse Chestnut | 13% | 27% | 34% | 17% | 8% | 2% |
| Jay Peg | 19% | 37% | 34% | 8% | 3% | 0% |
| Judpot | 13% | 30% | 39% | 11% | 5% | 2% |
| Kildonan | 11% | 37% | 22% | 19% | 11% | 0% |
| Rebel King | 29% | 30% | 25% | 16% | 0% | 0% |
| Royal Air Force | 23% | 46% | 15% | 15% | 0% | 0% |
| Sail From Seattle | 22% | 26% | 33% | 12% | 5% | 2% |
| Seul Amour | 46% | 15% | 31% | 0% | 8% | 0% |
| Spanish Harlem | 30% | 45% | 25% | 0% | 0% | 0% |
Male offspring of sires by rating
| Stallions | <55 | 55-69 | 69-79 | 79-89 | 89-99 | >99 |
| All COLTS | 18% | 22% | 26% | 19% | 10% | 5% |
| First crop 1994 | ||||||
| Fort Wood | 10% | 16% | 25% | 24% | 17% | 8% |
| First crop 1998 | ||||||
| Western Winter | 7% | 11% | 22% | 23% | 24% | 12% |
| First crop 1999 | ||||||
| Muhtafal | 13% | 17% | 28% | 25% | 11% | 7% |
| First crop 2002 | ||||||
| Captain Al | 9% | 15% | 23% | 27% | 16% | 9% |
| Century Stand | 23% | 33% | 25% | 13% | 2% | 4% |
| Count Dubois | 16% | 19% | 31% | 24% | 7% | 3% |
| Jet Master | 10% | 14% | 27% | 26% | 14% | 9% |
| Kahal | 18% | 24% | 23% | 19% | 10% | 5% |
| Lecture | 16% | 24% | 28% | 21% | 7% | 5% |
| First crop 2003 | ||||||
| Almushtarak | 37% | 17% | 24% | 17% | 5% | 0% |
| Announce | 14% | 29% | 27% | 19% | 9% | 1% |
| Asaal | 31% | 19% | 26% | 10% | 14% | 0% |
| Doowaley | 17% | 21% | 24% | 24% | 9% | 4% |
| Indigo Magic | 22% | 31% | 25% | 18% | 5% | 0% |
| Mogok | 20% | 19% | 29% | 18% | 10% | 4% |
| The Sheik | 30% | 21% | 29% | 15% | 5% | 1% |
| Windrush | 21% | 22% | 27% | 21% | 6% | 3% |
| First crop 2004 | ||||||
| Badger’s Drift | 12% | 31% | 29% | 16% | 6% | 6% |
| Silvano | 13% | 18% | 24% | 18% | 13% | 14% |
| First crop 2005 | ||||||
| Bezrin | 19% | 25% | 27% | 15% | 5% | 9% |
| Malhub | 31% | 23% | 22% | 12% | 9% | 2% |
| Sarge | 29% | 26% | 26% | 11% | 9% | 0% |
| First crop 2006 | ||||||
| Alado | 7% | 47% | 33% | 0% | 13% | 0% |
| Dupont | 18% | 25% | 24% | 25% | 3% | 4% |
| Dynasty | 13% | 19% | 27% | 17% | 16% | 9% |
| Spectrum | 22% | 25% | 27% | 16% | 9% | 2% |
| Toreador | 17% | 33% | 26% | 15% | 8% | 2% |
| Var | 10% | 13% | 29% | 29% | 12% | 7% |
| First crop 2007 | ||||||
| Battersea Park | 44% | 33% | 11% | 0% | 11% | 0% |
| Black Minnaloushe | 18% | 26% | 27% | 18% | 8% | 4% |
| Damage is Done | 100% | 0% | 0% | 0% | 0% | 0% |
| Greys Inn | 19% | 28% | 23% | 14% | 12% | 4% |
| Jam Alley | 42% | 26% | 21% | 5% | 5% | 0% |
| King of Kings | 30% | 26% | 30% | 9% | 3% | 2% |
| Lundy’s Liability | 23% | 31% | 15% | 15% | 10% | 5% |
| Miesque’s Approval | 21% | 30% | 29% | 13% | 6% | 1% |
| Overlord | 18% | 31% | 36% | 10% | 5% | 0% |
| Right Approach | 15% | 26% | 25% | 17% | 13% | 4% |
| Scripture | 75% | 25% | 0% | 0% | 0% | 0% |
| Solskjaer | 31% | 36% | 20% | 7% | 2% | 4% |
| Stagelight | 14% | 57% | 29% | 0% | 0% | 0% |
| Tiger Dance | 17% | 34% | 37% | 2% | 7% | 2% |
| Way West | 42% | 26% | 26% | 3% | 3% | 0% |
| Whitechapel | 25% | 37% | 19% | 12% | 6% | 0% |
| First crop 2008 | ||||||
| Go Deputy | 14% | 30% | 25% | 18% | 9% | 5% |
| Tobe Or Nottobe | 33% | 31% | 26% | 10% | 0% | 0% |
| First crop 2009 | ||||||
| Ashaawes | 26% | 26% | 26% | 9% | 14% | 0% |
| Atso | 34% | 43% | 11% | 9% | 3% | 0% |
| Imperial Stride | 27% | 27% | 13% | 20% | 13% | 0% |
| Lion Tamer | 29% | 41% | 6% | 24% | 0% | 0% |
| Mullins Bay | 22% | 37% | 30% | 6% | 3% | 2% |
| Ravishing | 41% | 30% | 15% | 11% | 4% | 0% |
| Soar With Eagles | 36% | 32% | 18% | 9% | 5% | 0% |
| St Petersburg | 44% | 32% | 12% | 8% | 4% | 0% |
| Trippi | 11% | 20% | 39% | 14% | 8% | 8% |
| First crop 2010 | ||||||
| A P Arrow | 32% | 48% | 16% | 4% | 0% | 0% |
| Admire Main | 25% | 17% | 50% | 8% | 0% | 0% |
| Antonius Pius | 26% | 21% | 17% | 26% | 11% | 0% |
| Argonaut | 29% | 32% | 24% | 11% | 5% | 0% |
| Daring Bid | 55% | 27% | 9% | 9% | 0% | 0% |
| Horse Chestnut | 18% | 36% | 24% | 12% | 6% | 3% |
| Jay Peg | 12% | 37% | 37% | 12% | 2% | 0% |
| Judpot | 6% | 31% | 37% | 11% | 11% | 3% |
| Kildonan | 7% | 27% | 33% | 20% | 13% | 0% |
| Rebel King | 36% | 22% | 25% | 17% | 0% | 0% |
| Royal Air Force | 40% | 40% | 20% | 0% | 0% | 0% |
| Sail From Seattle | 13% | 29% | 19% | 19% | 13% | 6% |
| Seul Amour | 50% | 17% | 17% | 0% | 17% | 0% |
| Spanish Harlem | 30% | 30% | 40% | 0% | 0% | 0% |
Female offspring of sires by rating
| Stallions | <55 | 55-69 | 69-79 | 79-89 | 89-99 | >99 |
| All FILLIES | 20% | 27% | 29% | 16% | 7% | 2% |
| First crop 1994 | ||||||
| Fort Wood | 8% | 18% | 34% | 22% | 14% | 3% |
| First crop 1998 | ||||||
| Western Winter | 7% | 19% | 32% | 27% | 13% | 3% |
| First crop 1999 | ||||||
| Muhtafal | 16% | 26% | 25% | 23% | 10% | 1% |
| First crop 2002 | ||||||
| Captain Al | 10% | 17% | 29% | 27% | 13% | 3% |
| Century Stand | 23% | 37% | 25% | 15% | 0% | 0% |
| Count Dubois | 26% | 21% | 29% | 14% | 8% | 3% |
| Jet Master | 11% | 21% | 23% | 26% | 14% | 6% |
| Kahal | 18% | 26% | 32% | 14% | 7% | 3% |
| Lecture | 18% | 33% | 32% | 9% | 7% | 1% |
| First crop 2003 | ||||||
| Almushtarak | 33% | 26% | 30% | 10% | 0% | 0% |
| Announce | 15% | 34% | 34% | 9% | 9% | 0% |
| Asaal | 36% | 28% | 16% | 20% | 0% | 0% |
| Doowaley | 21% | 35% | 28% | 12% | 4% | 1% |
| Indigo Magic | 25% | 25% | 29% | 17% | 4% | 0% |
| Mogok | 21% | 27% | 30% | 16% | 4% | 1% |
| The Sheik | 24% | 29% | 27% | 11% | 8% | 0% |
| Windrush | 19% | 27% | 30% | 16% | 6% | 2% |
| First crop 2004 | ||||||
| Badger’s Drift | 18% | 21% | 42% | 16% | 3% | 0% |
| Silvano | 15% | 24% | 32% | 19% | 8% | 3% |
| First crop 2005 | ||||||
| Bezrin | 33% | 28% | 26% | 11% | 2% | 0% |
| Malhub | 41% | 32% | 18% | 4% | 5% | 0% |
| Sarge | 13% | 40% | 33% | 11% | 0% | 2% |
| First crop 2006 | ||||||
| Alado | 43% | 36% | 14% | 0% | 7% | 0% |
| Dupont | 40% | 29% | 19% | 9% | 3% | 0% |
| Dynasty | 22% | 23% | 29% | 18% | 6% | 1% |
| Spectrum | 20% | 34% | 31% | 12% | 3% | 0% |
| Toreador | 25% | 30% | 25% | 13% | 6% | 1% |
| Var | 8% | 17% | 36% | 23% | 11% | 6% |
| First crop 2007 | ||||||
| Battersea Park | 25% | 25% | 50% | 0% | 0% | 0% |
| Black Minnaloushe | 31% | 28% | 25% | 10% | 6% | 0% |
| Damage is Done | 43% | 14% | 29% | 0% | 14% | 0% |
| Greys Inn | 27% | 29% | 25% | 19% | 0% | 0% |
| Jam Alley | 45% | 27% | 18% | 0% | 9% | 0% |
| King of Kings | 30% | 34% | 21% | 12% | 2% | 1% |
| Lundy’s Liability | 18% | 48% | 20% | 9% | 5% | 0% |
| Miesque’s Approval | 26% | 32% | 31% | 9% | 3% | 0% |
| Overlord | 28% | 39% | 28% | 6% | 0% | 0% |
| Right Approach | 25% | 32% | 33% | 9% | 2% | 0% |
| Scripture | 75% | 25% | 0% | 0% | 0% | 0% |
| Solskjaer | 22% | 41% | 16% | 16% | 5% | 0% |
| Stagelight | 36% | 36% | 9% | 18% | 0% | 0% |
| Tiger Dance | 33% | 30% | 22% | 15% | 0% | 0% |
| Way West | 30% | 34% | 21% | 7% | 7% | 0% |
| Whitechapel | 55% | 30% | 15% | 0% | 0% | 0% |
| First crop 2008 | ||||||
| Go Deputy | 29% | 32% | 24% | 12% | 3% | 0% |
| Tobe Or Nottobe | 40% | 26% | 30% | 5% | 0% | 0% |
| First crop 2009 | ||||||
| Ashaawes | 32% | 22% | 27% | 14% | 3% | 3% |
| Atso | 38% | 46% | 10% | 5% | 0% | 0% |
| Imperial Stride | 37% | 27% | 30% | 7% | 0% | 0% |
| Lion Tamer | 41% | 18% | 35% | 6% | 0% | 0% |
| Mullins Bay | 16% | 30% | 30% | 23% | 0% | 0% |
| Ravishing | 41% | 35% | 18% | 6% | 0% | 0% |
| Soar With Eagles | 25% | 42% | 17% | 17% | 0% | 0% |
| St Petersburg | 42% | 38% | 15% | 4% | 0% | 0% |
| Trippi | 6% | 22% | 47% | 13% | 6% | 7% |
| First crop 2010 | ||||||
| A P Arrow | 32% | 48% | 16% | 0% | 3% | 0% |
| Admire Main | 26% | 37% | 32% | 0% | 0% | 5% |
| Antonius Pius | 23% | 30% | 37% | 5% | 5% | 0% |
| Argonaut | 41% | 29% | 27% | 2% | 0% | 0% |
| Daring Bid | 67% | 33% | 0% | 0% | 0% | 0% |
| Horse Chestnut | 6% | 16% | 45% | 23% | 10% | 0% |
| Jay Peg | 28% | 36% | 31% | 3% | 3% | 0% |
| Judpot | 18% | 29% | 41% | 10% | 0% | 2% |
| Kildonan | 17% | 50% | 8% | 17% | 8% | 0% |
| Rebel King | 24% | 35% | 25% | 16% | 0% | 0% |
| Royal Air Force | 12% | 50% | 12% | 25% | 0% | 0% |
| Sail From Seattle | 26% | 24% | 42% | 8% | 0% | 0% |
| Seul Amour | 43% | 14% | 43% | 0% | 0% | 0% |
| Spanish Harlem | 30% | 60% | 10% | 0% | 0% | 0% |